

Warren Buffett was infamous for stating that he spent most of his day sat around reading biographies, select newspapers, and company reports. The first of those gives you a personal account of how somebody achieved something over time. The second; up-to-date current affairs, analysis and plain right speculation. The company report, however, is both an account of how a company has achieved something over a certain time period—whilst also allowing room for different forms of analysis, speculation and interpretation.
Charlie Munger said that to get ahead in life you need to understand the basic concepts of the hard sciences: physics, chemistry, engineering and maths. And while accountancy is more art than science, it should go without saying that every investor—whether you buy stocks, real estate or commodities—and every current or aspiring business owner, should be able to understand and interpret financial statements.
Why?… because your capital depends on it.
Regardless of how much money you do or don’t have—nobody likes to lose it. Especially not to ignorance.
Financial statements are broken down into three main documents: the income statement, balance sheet and cash flow statement. Today we’ll be going through the income statement and breaking down what each line means. This document lets you know if the company you own or stock you want to buy is profitable.
But don’t take my word for it. Here’s an excerpt from the brilliant book Financial Intelligence:
“Learn to decipher this document, and you will be able to understand and evaluate your company’s profitability. Learn to manage the lines on the income statement that you can affect, and you will know how to contribute to that profitability. Learn the art involved in determining profit, and you will definitely increase your financial intelligence. You might even get where you are going.”
To help put the scary and confusing definitions into context, we’ll be using Amazon and Visa as example companies. One of them (Amazon) produces products and services and the other (Visa) is a service-based company that collects fees on transactions. Both are well known for what they do, and you should always start with companies you already know a lot about.
This is an in-depth one, so you might want to bookmark this in case you want to come back to it. If you’re reading this in email and the email is truncated click on "View entire message" and you’ll be able to view the entire post in your email app.
A Few Tips Before You Start
Where to Find Them
When you want to read a company’s financial report, you have some options on where you can find them:
Investor Relations Pages: Most large corporations will have dedicated “investors” or “investor relations” sections on their website where an archive of their reports will live in PDF for you to read/download.
Third-Party Aggregators (free & paid): AnnualReports.com: A free directory of annual reports for listed companies across the UK, US, Canada, and Australia. Financial News & Portals: Sites like Yahoo Finance and the Financial Times (FT) Markets Data often provide links to annual reports on their company “tearsheet” pages. Specialised Databases: For deep research, subscription services like FAME (for UK/Ireland), S&P Capital IQ, and LSEG Data & Analytics provide consolidated financial data and original filing images. I personally use a paid service called Fiscal.ai, who also offer a free version (no affiliation).
Official Government & Regulatory Portals (free): Companies House (UK), EDGAR / SEC (USA), SEDAR+ (Canada), for example.
Or, just type in “COMPANY NAME annual report” into your favourite search browser.
Nomenclature
When reading financial statements, you’d have thought that there would be concrete wording for each definition but alas, there isn’t—there are multiple names for the same thing. Sales, top line, turnover and revenue aren’t different things—they’re the same. Net profit is also known as bottom line, net income, net earnings and net income after taxes (NIAT). At first this can be confusing, especially when looking at income statements from different companies, but I’ve tried to make it as easy as possible to understand by breaking down the income statement into six key components which I list before reviewing Amazon and Visa’s income statements.
Standardised vs Reported
Probably a bit beyond this article, but you should know that companies have to follow certain rules when it comes to financial statements. Depending on where you live, these might be called GAAP, US GAAP, IFRS or something else. The basis for these complicated accounting rules is to “standardise” how companies report their numbers so that the average Joe (and investor) can understand them as there is continuity across reports and companies. Most companies also report non-GAAP figures in their reports, as they may believe it represents a better picture of the company’s actual financials.
What Currency Is It In?
This might sound obvious but shouldn’t be overlooked. Be sure to check whether the numbers are in pounds, American/Canadian dollars, euros or something else. If you want to convert that currency back to your own, remember that the currency conversion rates might be different today from the reported numbers. This is where online websites excel over print or static copies because many allow you to select the company’s local currency, USD, or the currency of your country and convert the numbers for you.
Thousands, Millions or Billions?
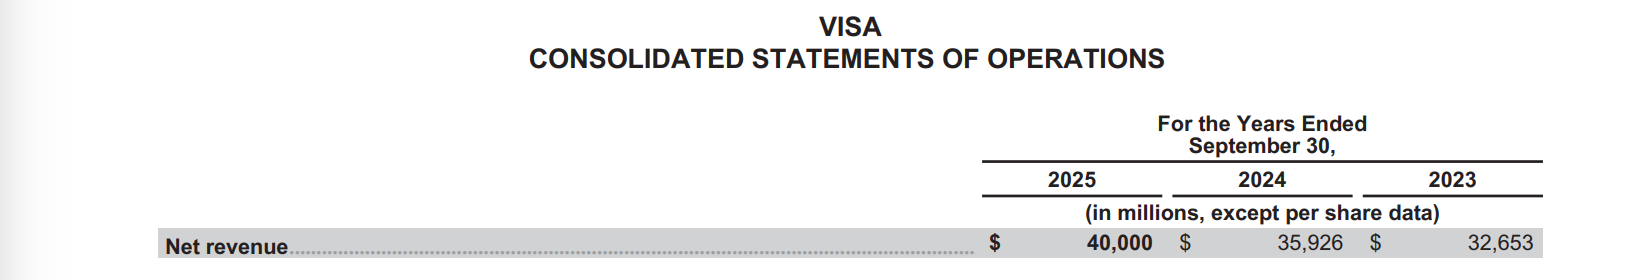
Are the numbers you’re reading in thousands, millions or billions? At the top of each statement, the company should state what the numbers are “rounded” to. Here’s a screenshot from Visa’s 2025 Annual Report that tells you the numbers are in “millions.”
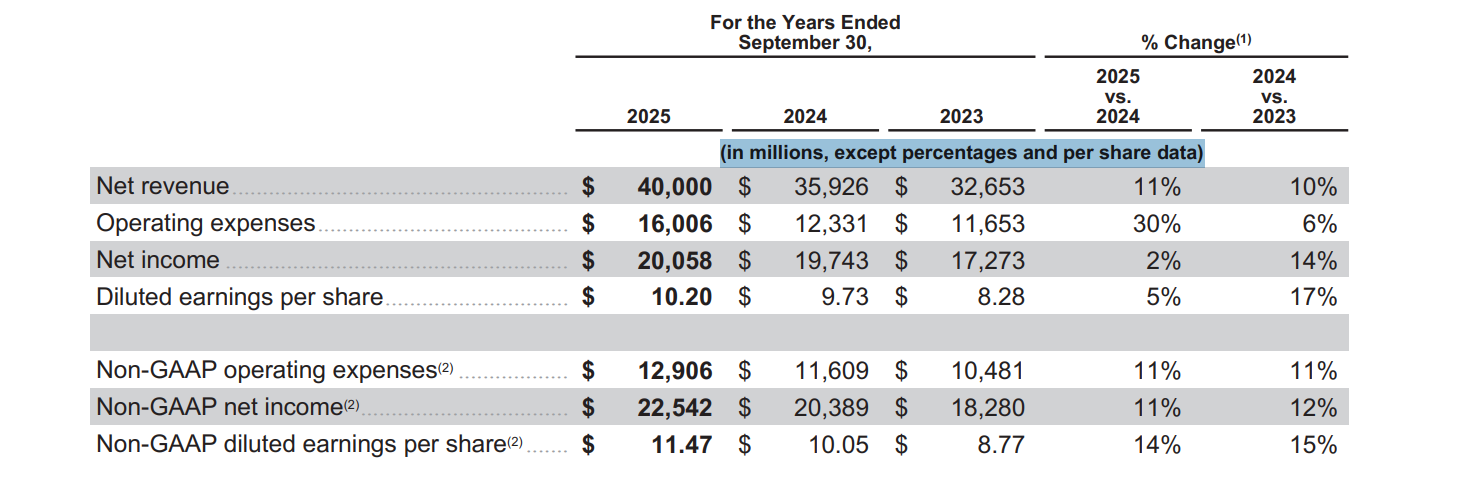
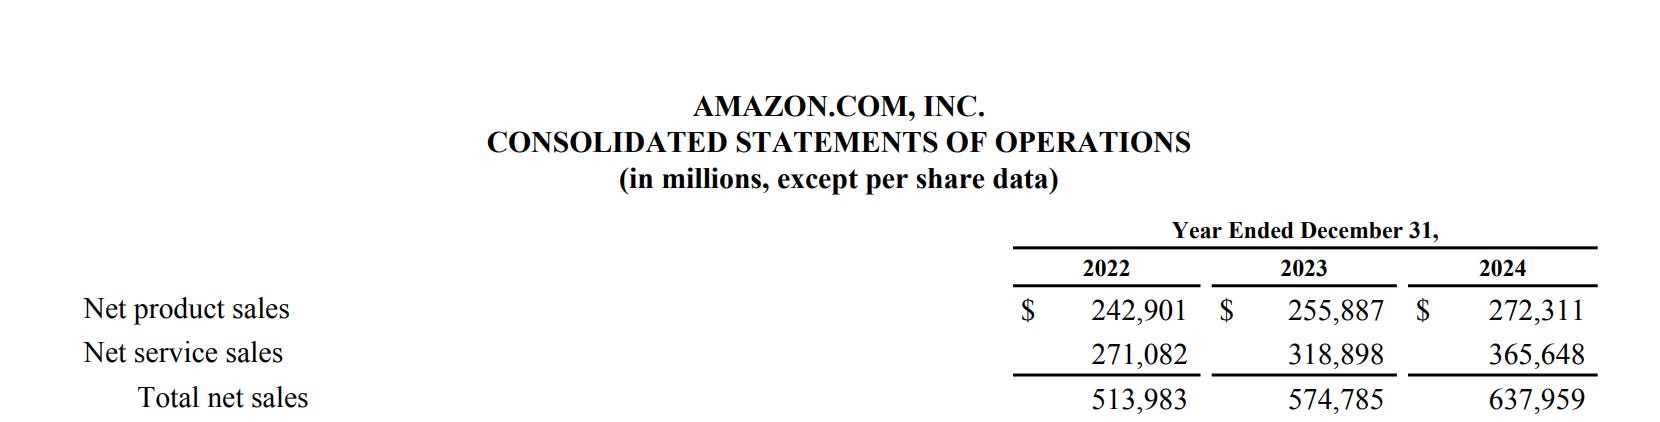
Before we begin, have a quick look at Amazon and Visa’s “statements of operations” which is just their way of saying... income statement, and have a go at guessing what you think the definitions mean, how both companies differ slightly, and why.
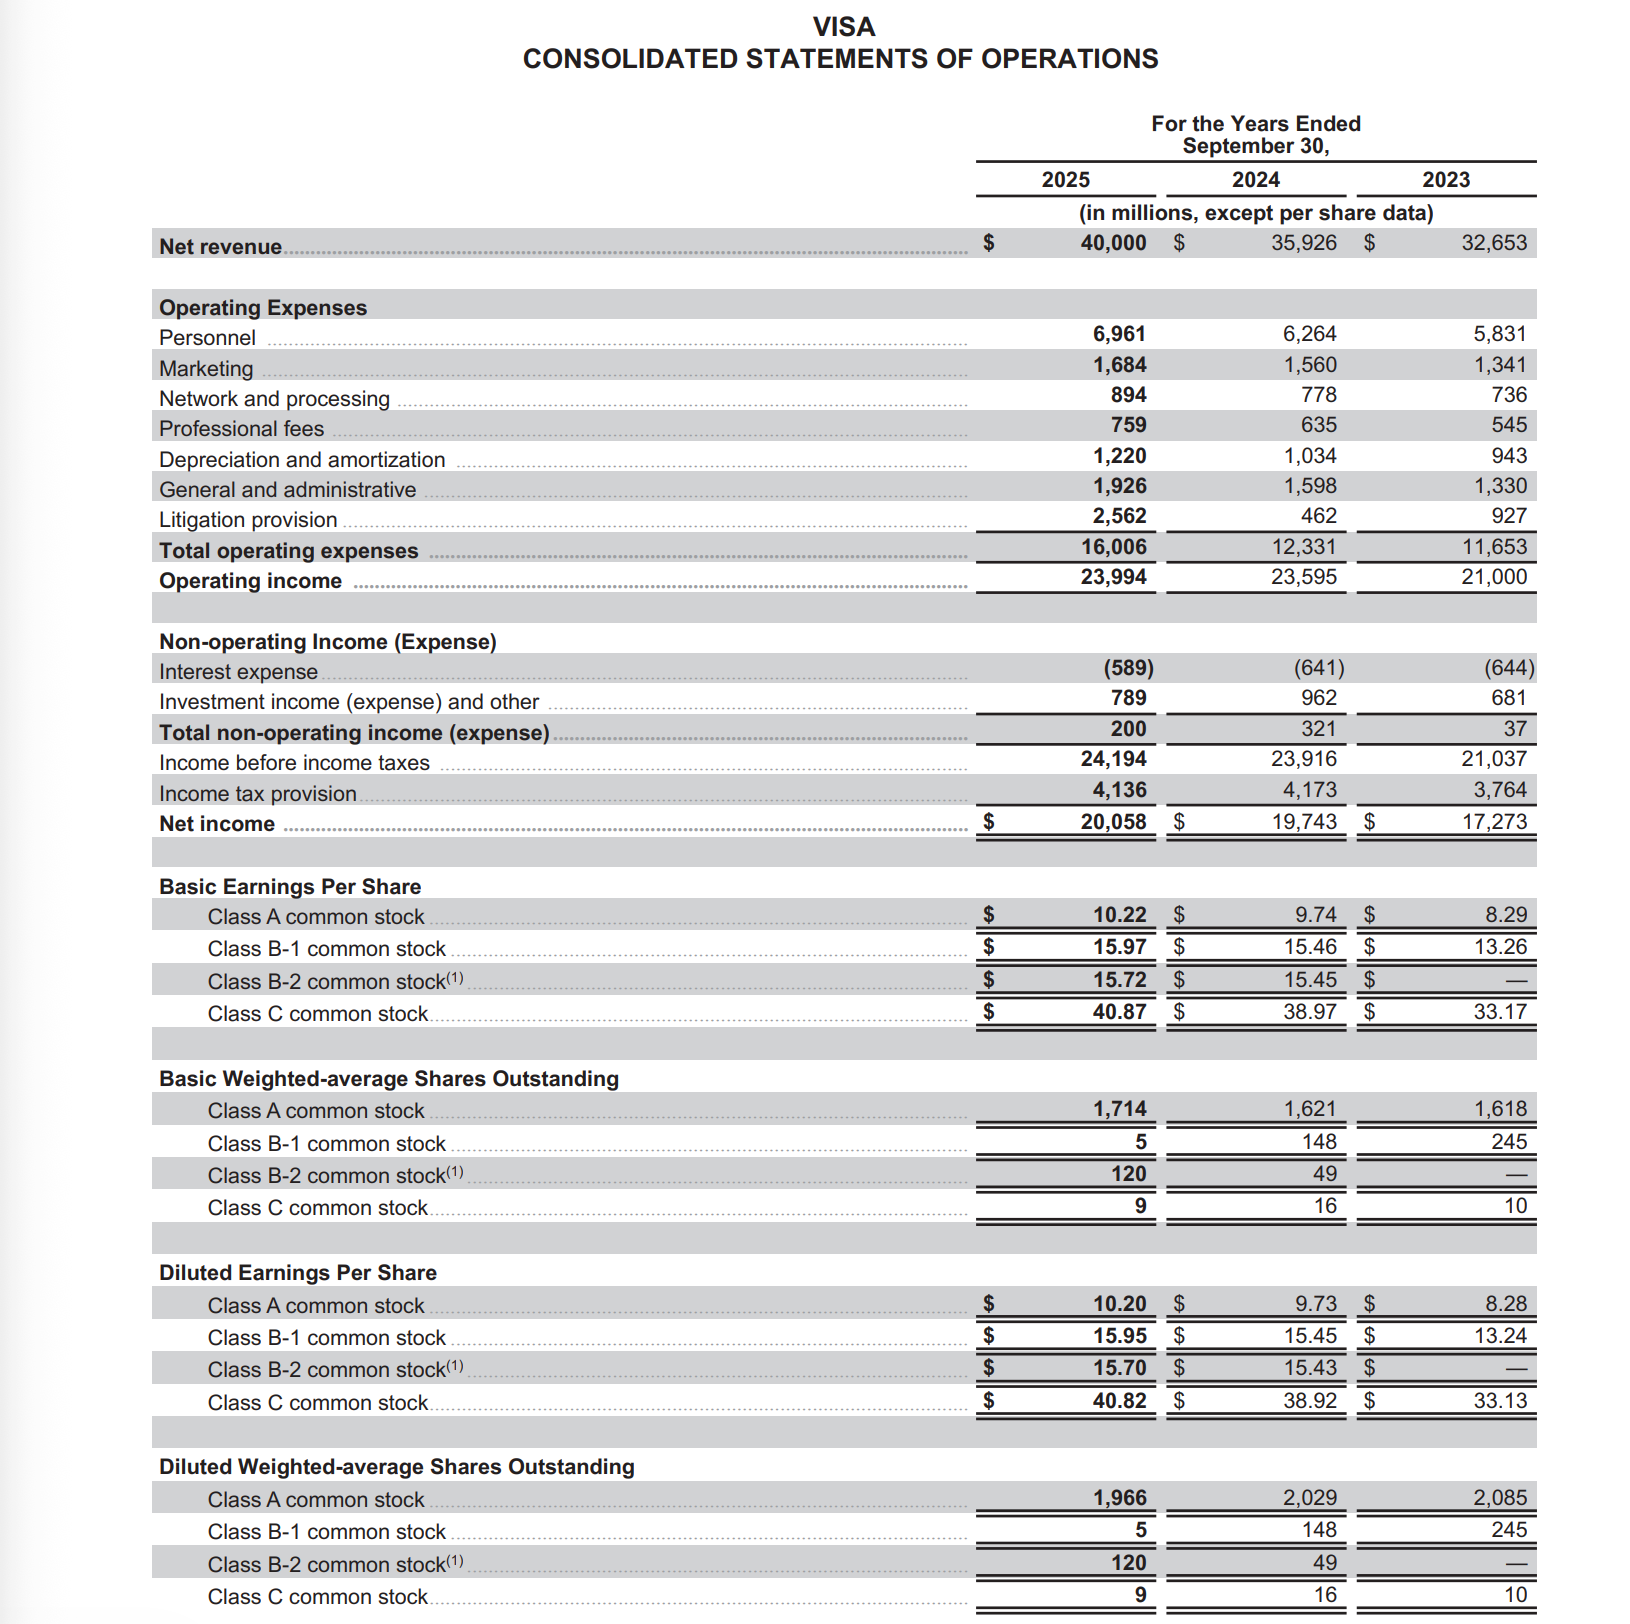
Visa
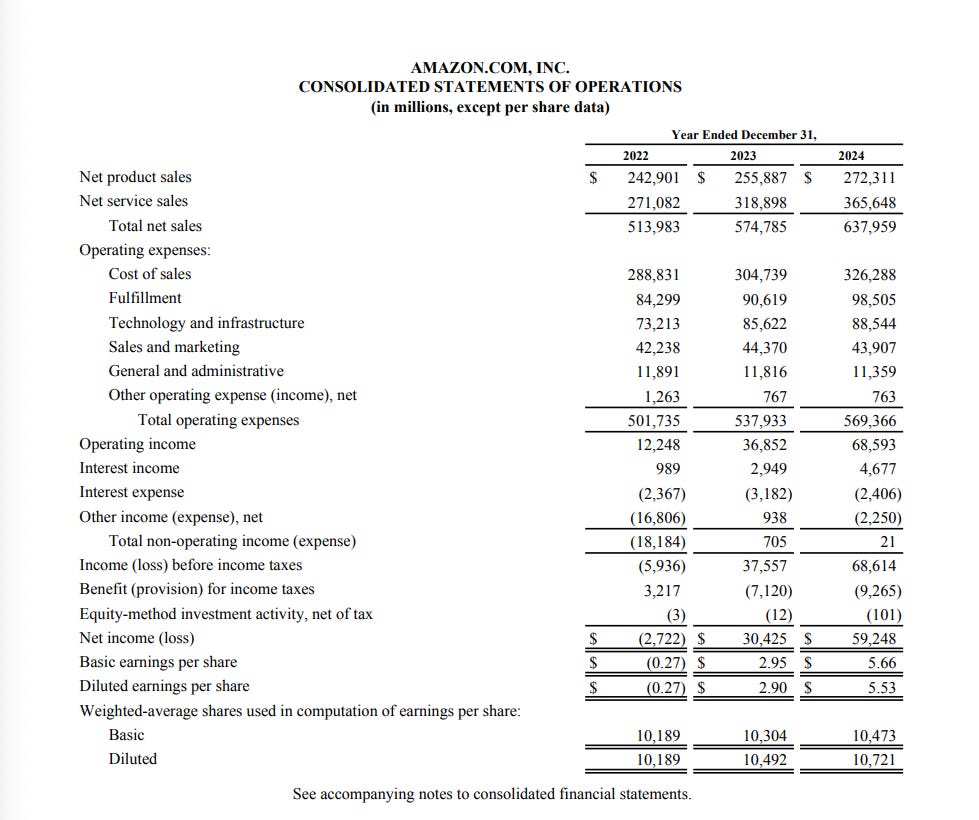
Amazon
To better understand the income statement, you can break it down into six key sections: 1. revenue, 2. operating expenses, 3. operating profit, 4. non-operating income, 5. taxes, and 6. net profit. That’s it.
Beyond that, you can introduce ratios, margins and percentage changes to the numbers to help assist you with your analysis of a company. A word of warning though: up isn’t always good and down isn’t always bad. Remember when I said it’s more art than science?
Let’s get into it.
1. Revenue
Visa calls it net revenue and Amazon calls it net sales (broken down into products and services) but they’re the same thing. It’s the total amount of money the company has charged its customers from selling its products or services over a given period and before costs are deducted. Revenue can certainly make you gleeful when first looking at it but revenue certainly isn’t profit. At least not yet.
Visa
Amazon
* You’ve probably noticed that Visa’s latest year is on the left hand side and Amazon’s is on the right. Don’t ask me why but be aware—there are little traps everywhere trying to trip you up if you’re not paying attention.
Revenue should only be recognised when a product or service is delivered. Here are some differences between when Amazon and Visa recognise revenue:
Amazon (Direct Sale): When you buy a $100 Echo from Amazon’s own inventory, they record the full $100 as revenue. They are the “Principal” in this transaction.
Visa (The Fee): When you use a Visa card for that same $100 purchase, Visa doesn’t count the $100. They only record their small transaction fee (often just cents) as revenue. They are a “Service Provider.”
Amazon (Third Party): When third-party sellers make a sale on Amazon, Amazon does not recognise the full amount of the sale as revenue. Instead, they only record their net share plus commissions and fulfilment fees.
But when something’s delivered can mean different things for different people. In the book Financial Intelligence, the author asks what you would do in these situations:
- Your company does systems integration for large customers. A typical project requires six months to design and be approved by the customer, then another twelve months to implement. The customer gets no real value from the project until the whole thing is complete. When have you earned the revenue that the project generates?
- Your company sells to retailers. Using a practice known as bill-and-hold, you allow your customers to buy product (say, a popular Christmas item) well in advance of the time they will actually need it. You warehouse it for them and ship it out later. When have you earned the revenue?
- You work for an architectural firm. The firm provides clients with plans for buildings, deals with the local building authorities, and supervises the construction or reconstruction. All these services are included in the firm’s fee, which is generally figured as a percentage of construction costs. How do you determine when the firm has earned its revenue?
The first example I’m not too sure, the second I would say once the product is shipped, and the third I have direct experience in as I co-run a construction company and deal with architects all the time. They’ll take 90% of it up front and do f-ck all after that.
Relax, architects—i’m joking. I know you work in milestones.
2. Operating Expenses
Operating expenses are the costs the company incurs from making a product, delivering a service or running the company’s day-to-day operations. Some directly contribute to growing the business such as (COGS/COS), some keep it afloat (SG&A) and others look to bring work in or develop products (marketing, R&D). Take a look at some of the differences between the two companies.
Visa
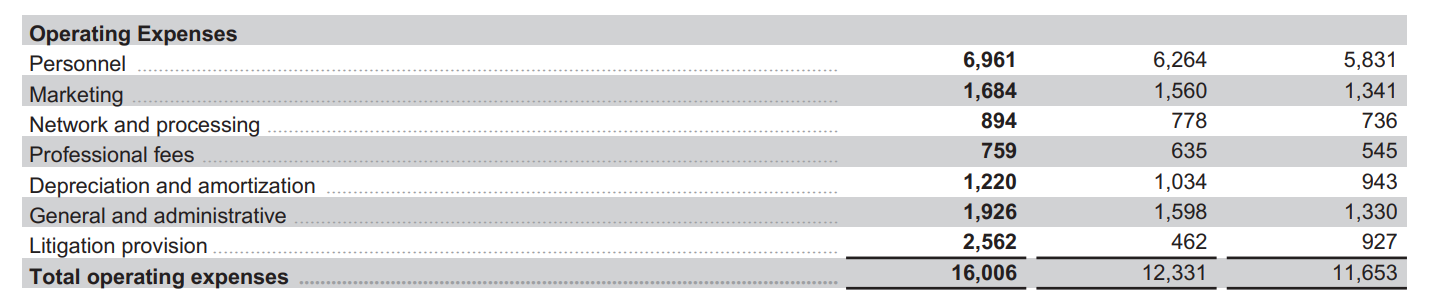
Amazon
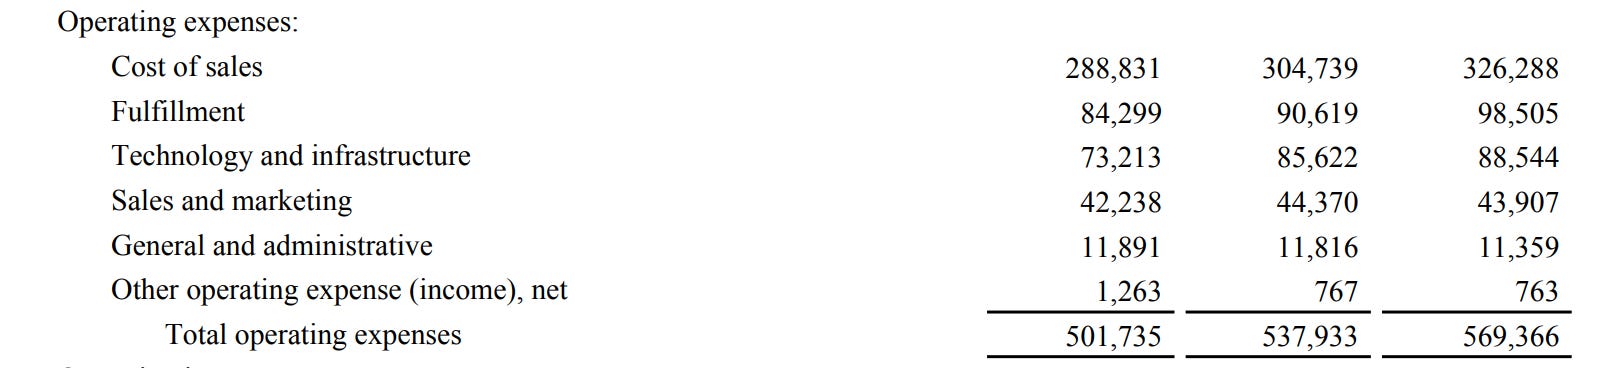
Both companies have different types of operating expenses because they’re two very different companies but, on most statements you’ll find the following:
Cost of Goods Sold / Cost of Services (COGS/COS)
Cost of Goods Sold or Cost of Services represent the direct costs to the company for producing a product or service—the materials, labour and delivery.
For companies that sell products like Amazon, it’s easier to attribute a cost to a physical product plus work out the inbound shipping costs. For companies like Visa, who offer a service, it’s harder to tie a specific cost to a specific unit of service.
Selling, General & Administrative (SG&A)
A catch-all for costs that fall outside of COGS/COS and don’t directly contribute to growing revenue but keep the lights on and the company ticking over. Think of things such as:
Salaries
Office rent
Marketing
Advertising
Legal or HR fees
Depreciation & Amortisation (D&A)
This is a “non-cash” expense. Accountants spread tangible assets like equipment, vans and buildings, or intangible assets like software and patents out over their useful life for accounting purposes and record this on the income statement. If my company buys a van for £36,000, the accountant, if using a straight-line method of depreciation, might determine that the useful life of the van is 3 years and would allocate a £1,000 cost of the van per month to the income statement.
My company is not paying out £1,000 per month as the van was bought in a previous accounting period using cash, debt or a mix of both but, it’s still expensed and thus comes off the company’s gross profit.
Research & Development (R&D)
R&D is money a company is spending on researching and developing future products, services or processes. For Amazon, think Amazon Echo, Firestick, Prime, etc. Visa doesn’t explicitly have an R&D section, but does have a “Network and Processing” line which, if Visa is making improvements to their systems, you could argue this is R&D.
Total Operating Expenses
This represents the total costs of all operating expenses and is subtracted from revenue. You can see how Visa—a service provider, has significantly less operating costs than Amazon that has physical infrastructure and inventory.
If you have money left over after all costs are subtracted, well done—you’ve made an operating profit. But you still can’t get too excited yet. You’re closer to making a profit, but it’s no home run.
3. Operating Profit
Once all operating expenses are subtracted from revenue, you arrive at operating profit. Operating profit is a useful metric when assessing the health of a company because it gives you an indication of how profitable the company is before you start to add or deduct tax, interest, and other investment income. Things that don’t really have any bearing on how well the company is operating from the products or services it sells.
Visa

Amazon

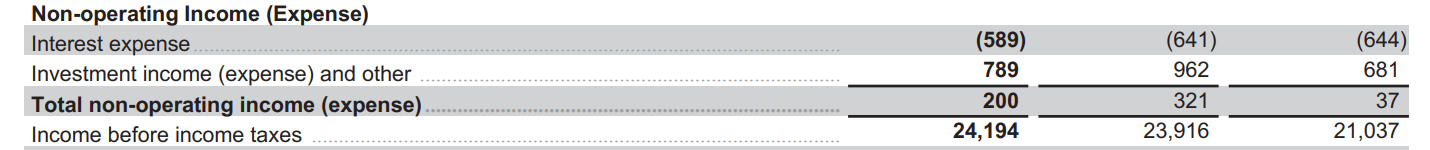
4. Non-Operating Income
Companies can also make money from activities that do not directly contribute to their operations.
Visa
Amazon
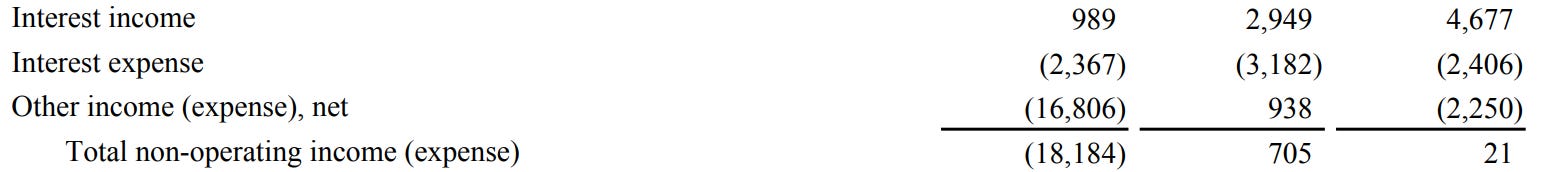
Non-operating income can include:
Interest Income
Interest earned from cash in a savings account
Interest from government or corporate bonds the company holds
Interest received from notes receivable or loans to third parties
Investment Income
Dividends they receive from shares held in other companies
Realised gains from selling physical assets such as property, plant, equipment
Stock they sell (if they sold it for more than they bought it)
Rental income from investment properties that may not be related to the primary business
They could also owe money.
Interest (Expense)
Interest expense is the cost of borrowing funds the company may have used to grow the business, make an acquisition or pay down bad debt (swapping high-interest debt for low).
Total Non-Operating Income
Total non-operating income is what the company earned from interest and investment income minus any interest paid (expensed). If it’s a plus, the number is added to operating profit, and if it’s negative, deducted.
5. Tax Provisions
When companies make profits, they have to pay taxes, and what the company’s liability for that tax will show up here before the bottom line—net profit.
Visa

Amazon

As these companies are global powerhouses you’ll have to do some digging as where they paid they tax if that’s you’re thing. Is it all in the states or is it spread over regions?
6. Net Profit/Income
Net Profit is the bottom line of the income statement. If you’ve made a profit it’s what’s distributable to shareholders of publicly listed companies, or the owners of private companies, after all costs, interest and investments, taxes, and any one-time charges are removed from revenue.
Visa

Amazon

Considering Amazon’s revenue was almost 16x Visa’s they’re not too far apart when it gets to the bottom line. Being the beast they are, Amazon needs to keep spending money on new warehouses, fleet and product development to keep growing. On the other hand, people are increasingly paying less with cash and more with their cards. Visa, and Mastercard own a duopoly in this space and have done for decades.
If you only understand those six sections, you’ll already be ahead of buckets of people when it comes to understanding the income statement. For those that want to analyse the statement in a little more depth, you can look at the following.
This article is from “The Nuts & Bolts” section where I provide business operators and investors the mechanisms and manuals to make better decisions. To continue viewing articles like this please consider upgrading to The School of Knowledge+.
Margins, Percentages and Ratios
Gross Profit Margin
Gross profit is what’s left after Cost of Goods Sold (COGS) and Cost of Service (COS) is subtracted from Revenue. Gross Profit can also be expressed as a percentage to monitor profitability of a company’s products and services at a rudimentary level.
Visa’s revenue for September 2025 was $40 billion and its cost of sales was $7.9 billion. Therefore, its gross profit was $32.1 billion.
To see that as a percentage (or margin), just do the following calculation:
$32.1 / $40 = 0.8025
0.8025 x 100% = 80.25%
*I’ve rounded the numbers.
Operating Margin
Like gross profit margin, investors and business owners want to keep an eye on the operating margin of a business and understand why it’s moving in one direction or another. Is the corporate office bloated and dragging down margins? Is the company embroiled in a legal dispute with fees adding up? What about the other way—why has your operating margin jumped 10% this year? Maybe you’ve cut back on marketing or used internal employees instead of consultants who’ll likely charge higher fees.
Either way you need to ask: Is what you’re seeing sustainable or is it smoke and mirrors?

To get to this figure, the calculation is as follows:
$68.6 / $638 = 0.108
0.108 x 100% = 10.75%
Net Profit Margin
Net profit margin is expressed as a percentage once all operating costs, non-operating costs and tax provisions are subtracted from revenue. It tells you what the company earned as a percentage in relation to revenues. Low margins are vulnerable to sudden price changes or one-off charges. Think Trump and his tariff war the last 6 months.

$20 billion (net profit) / $40 billion (revenue) x 100%
$20 / $40 = 0.5
0.5 x 100% = 50%
Percentage Change of a Metric
If you want to track a metric change of a company, such as revenue to see if it’s improving or declining, use the following calculation:
Current year - prior year
/
prior year =
x 100%
Example:
If this year’s revenue is £550,000 and last year’s revenue was £500,000, the calculation would be as follows:
£550,000−£500,000 = £50,000
/
£500,000
= 0.1
0.1 x 100 = 10%
Earnings Per Share
Earnings per share (EPS) is a company’s net profit divided by the number of shares outstanding. EPS is a number that investors, particularly Wall Street keep an eye on. An EPS miss will almost certainly drag the stock price down but weirdly enough it rising can sometimes do the same. Who’d be an investor.

Final Thoughts
The income statement answers one question: Is this company profitable? A company showing a loss this year might have been profitable eight of the last ten years. Is it a good company or a bad company then? When analysing a company—you’re own included, you want to look for trends overtime. Has revenue grown at a healthy rate over the last 5-10 years? Has D&A rocketed suddenly (think AI/tech stocks)? If so, why? Why is this companies gross profit 15% higher/lower than it’s industry peers?
If you like solving puzzles or murder mystery games you might do well at investing. If you can smell bullshit a mile away, even better.
You should now, at least on a basic level, be able to answer that primary question, understand what each definition means, and how to get to net profit. Understanding the nuances though is just a little more difficult and will require reading many income statements form different companies and industries.
Here’s a quick checklist of everything we’ve gone through:
Before diving in, tick off these basics:
Check the currency: pounds, dollars, euros?
Check the scale: thousands, millions, or billions?
Identify the reporting period: quarterly or annual?
Note the accounting standard: GAAP, US GAAP, or IFRS?
Then work through the six key sections:
1. Revenue: the top line; what the company charged customers
2. Operating Expenses: COGS, SG&A, D&A, R&D
3. Operating Profit: revenue minus operating expenses
4. Non-Operating Income: interest, investments, and other gains/losses
5. Tax Provisions: what’s owed to the taxman
6. Net Profit: the bottom line; what’s left for shareholders
Key calculations:
Gross Profit Margin = (Revenue − COGS) ÷ Revenue × 100
Operating Margin = Operating Profit ÷ Revenue × 100
Net Profit Margin = Net Profit ÷ Revenue × 100
Percentage Change = (Current Year − Prior Year) ÷ Prior Year × 100
And, remember:
Revenue isn’t profit
Up isn’t always good; down isn’t always bad. Understand why it’s so.
The same thing has multiple names (revenue = sales = top line = turnover)
It’s more art than science.
Until next time, Karl (The School of Knowledge).
This article is from “The Nuts & Bolts” Section where I provide business operators and investors the mechanisms and manuals to make better decisions. To continue viewing articles like this please consider upgrading to The School of Knowledge+.
References:
Financial Intelligence by Karen Berman & Joe Knight
Amazon 10-K - Feb 2025
Visa 10-K - June 2025
Great article, thank you.